

So. January 2021. Anything interesting happen this month? YIKES.
Well, the internet keeps on chugging along, and so too do the APIs that keep it humming. And we’ve been watching so we can bring you this week’s API ratings.
For our API ratings, we look at over 100 APIs and pull all the metrics together to give you a general feeling for the service quality for an organization’s APIs in a particular API ratings category with our patented CASC score.
Something of interest
Social Networks is a competitive category and one that has been in the news much of late!
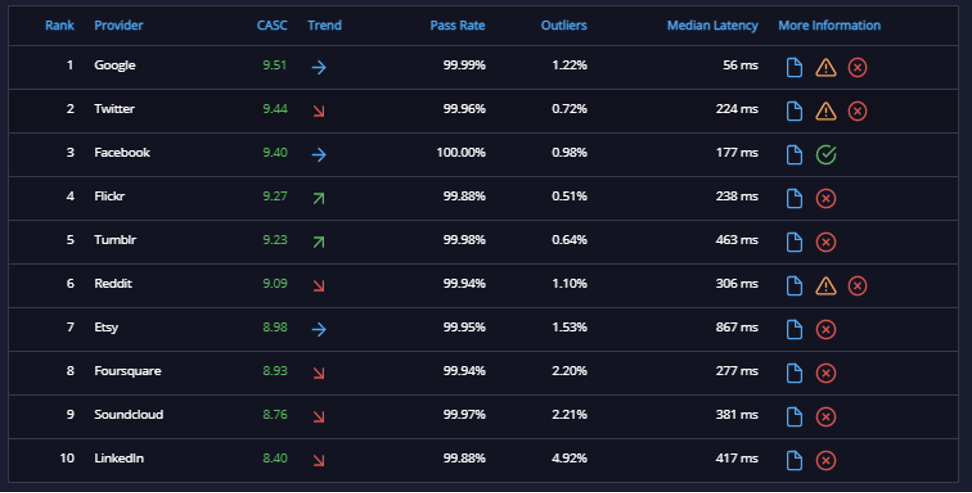
Twitter and Facebook both manage impressive CASC scores of 9.44 and 9.40 respectively. This is what you would expect. These companies can attract and retain the best engineering talent in the world. They should have good CASC scores! These are both global companies. They are not focused on any single geography. And a lot of people use Twitter and Facebook via apps hosted on a range of different cloud services.
So you would want to make sure that user experience is pretty similar wherever you are in the world and whatever cloud service you are using. But that’s not quite what we find.

Twitter is fastest in North America, but Europe is far behind. Azure is a real issue. East Asia is competitive except for Azure as is South America. Azure is the laggard in South Asia, but this is the slowest overall region. Twitter obviously doesn’t co-host in South Asia.
Given the strategic importance of this region, that might be missing a trick, but whichever way, it’s through active monitoring that you can see just what level of service you are providing to all your customers globally.
Twitter needs at the very least to have a good, hard look at what is happening with Azure outside North America and Europe. It’s not good.

The situation is a bit more complicated for Facebook. Performance in East Asia and South Asia are similar, so it looks like Facebook host in all regions (South America is fast, which is often not the case). The anomalies are more on an individual basis.
Why is Azure slow in East Asia and South Asia and IBM Cloud in Oceania, which is over 300 ms slower than its nearest competitor?
Twitter and Facebook are both highly performant APIs and I don’t doubt their DevOps teams could iron out these issues and ensure all their users are getting the best possible experience.
API Ratings: Overall Quality
Week Ending 18 January 2021
|
Category |
Organization |
CASC score
|
|
Corporate
|
GitHub |
9.44 |
|
COVID-19 |
WHO |
9.47 |
|
Search
|
|
9.20 |
|
Social Networks
|
|
9.57 |
|
UK Government
|
GOV.UK |
9.69 |
|
US Government
|
Department of Justice |
9.68 |
|
Messaging
|
Zoom |
9.04 |
API Ratings: Top Performers by Latency
Week Ending 18 January 2021
|
Category |
Organization |
Median Latency
|
|
Corporate Infrastructure
|
Microsoft Office |
222 ms |
|
COVID-19 |
WHO |
78 ms |
|
Search
|
|
390 ms |
|
Social Networks
|
|
54 ms |
|
UK Government
|
Police.UK |
84 ms |
|
US Government
|
Department of Justice |
48 ms |
|
Messaging
|
Slack |
267 ms |
API Ratings: Worst Quality
Week Ending 18 January 2021
|
Category |
Organization |
CASC score
|
|
Corporate Infrastructure
|
Nobody under 8.00!
|
|
|
COVID-19 |
5.95 |
|
|
Search
|
Nobody under 8.00! |
|
|
Social Networks
|
Nobody under 8.00!
|
|
|
UK Government
|
NHS |
6.41 |
|
US Government
|
NASA
|
6.51 |
|
Messaging
|
Nobody under 8.00!
|
Do more with API monitoring!
If you are new to APImetrics, sign up for a free trial so see how they could work for you with our free API set.
If you have any questions, please don't hesitate to contact us.