

Something of interest
Social Networks is a pretty competitive category for API metrics, which is not surprising given the centrality of social networks in contemporary life. Six out of 10 APIs have a CASC score over 9.00, and all but one have a CASC score of 8.52 or more and thus firmly in the Green Zone. Only Reddit is languishing in the Amber Zone this week.
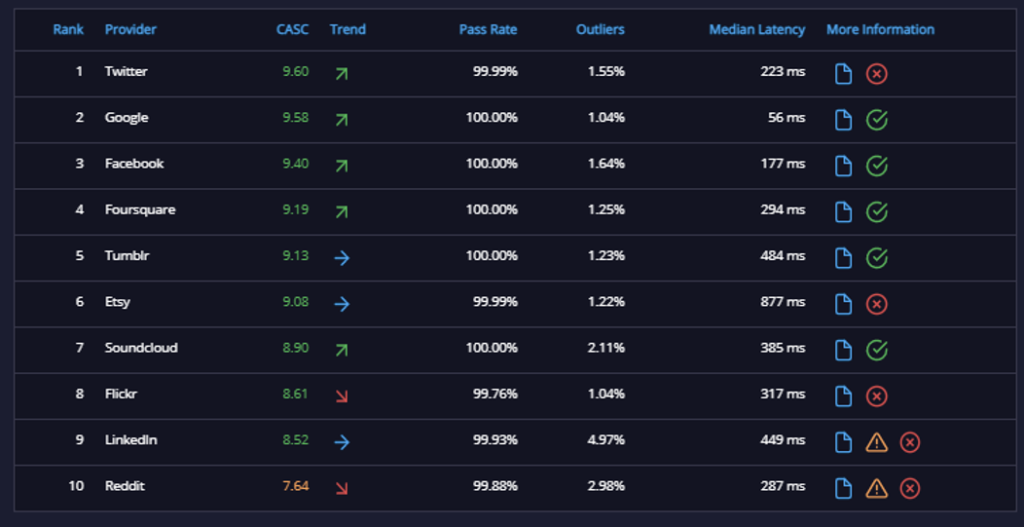
Twitter takes the API metrics title this week with a CASC score of 9.60, only 0.02 points ahead of Google, which actually has a better pass rate, outliers and median latency, so it is the standard deviation that’s pulling it down.
What’s going on there?

Straightaway, we can see a glaring issue. The slowest location is Google Oceania. Oceania locations often can be slow because of the region’s location, but AWS, Azure and IBM Cloud are about three times faster than Google for Google’s own API here, so something is definitely amiss.
Google in South Asia and North America are blisteringly fast with median latencies of 26 ms and 27 ms respectively and Europe not far behind at 30 ms. So South America, South Asia and, especially, Oceania, are badly out of kilter.
This is why you need to monitor your APIs actively because if you aren’t you don’t what kinds of problems your users are experiencing – and where those problems arise so that you can see straightaway where to start fixing them.

A look at Process Time immediately tells us where the problem is with Google in South America, South Asia and Oceania. For other clouds, Process Time is fast, just as we would expect for a quick API.
Indeed, Process Time shouldn’t typically depend on location unless there is a load-balancing architecture with multiple data centers. But there is very clearly something wrong if Google is picking up a whole 300 ms of extra latency because of the Process Time component (and tens of milliseconds in South America and East Asia).
Whether the problem is in fact with a network configuration (internal tromboning perhaps) or whether it is something to do with the local backends in those regions, this definitely needs resolving in order to make the Google Social Networks API the best it can be.
API Metrics: Overall Quality
Week Ending 1 February 2021
|
Category |
Organization |
CASC score
|
|
Corporate
|
GitHub |
9.59 |
|
COVID-19 |
ubentos.com |
9.53 |
|
Search
|
Microsoft Bing |
9.34 |
|
Social Networks
|
|
9.60 |
|
UK Government
|
GOV.UK |
9.71 |
|
US Government
|
Bureau of Labor Statistics |
9.81 |
|
Messaging APIs
|
Zoom |
9.13 |
API Metrics: Top Performers by Latency
Week Ending 1 February 2021
|
Category |
Organization |
Median Latency
|
|
Corporate Infrastructure
|
Microsoft Office |
222 ms |
|
COVID-19 |
WHO |
82 ms |
|
Search
|
|
382 ms |
|
Social Networks
|
|
56 ms |
|
UK Government
|
Police.UK |
83 ms |
|
US Government
|
Department of Justice |
82 ms |
|
Messaging APIs
|
Slack |
268 ms |
API Metrics: Worst Quality
Week Ending 1 February 2021
|
Category |
Organization |
CASC score
|
|
Corporate Infrastructure
|
Nobody under 8.00!
|
|
|
COVID-19 |
4.92 |
|
|
Search
|
Nobody under 8.00! |
|
|
Social Networks
|
|
7.14 |
|
UK Government
|
NHS |
6.35 |
|
US Government
|
General Services Administration
|
5.65 |
|
Messaging
|
RingCentral (Sandbox)
|
7.16 |
Do more with API monitoring!
If you are new to APImetrics, sign up for a free trial so see how they could work for you with our free API set.
If you have any questions, please don't hesitate to contact us.